Heatmap Visual
for Power Bi
Transforming Complexity into Clarity.
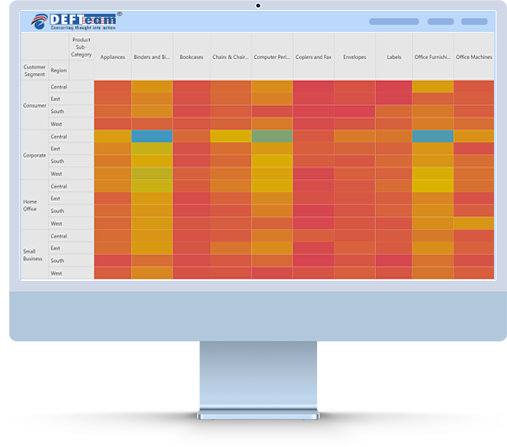
Heatmaps play a pivotal role in modern business analytics by providing a visually intuitive representation of complex data sets. These graphical representations enable businesses to identify patterns, trends, and outliers in their data, fostering informed decision-making. Heatmaps excel at highlighting variations in data intensity, making them particularly valuable in areas like customer behaviour analysis, website optimization, and sales performance evaluation. By presenting data in a color-coded format, heatmaps make it easy for stakeholders to quickly grasp information, facilitating efficient communication and collaboration within an organization. Businesses leverage heatmaps to gain insights into user engagement, identify geographical hotspots, and optimize resource allocation. In a world inundated with data, the importance of heatmaps lies in their ability to transform raw information into actionable intelligence, ultimately empowering organizations to make data-driven decisions for sustained success.
Need help in building Power Bi Custom visual?
DEFTeam helps businesses and organizations in building custom visuals for Power BI.
Frequently Asked Questions
-
How is Heatmap visual Priced?
- Heatmap visual is licensed per user per month basis.
- Amount charged for license is on yearly basis.
-
Can I use Heatmap visual in Organization Custom Visual Repository?
- We strongly recommend installing Heatmap visual in Organization Custom Visual Repository.
- This feature allows users to get access to custom visual and receive the updates automatically when uploaded by Power BI Admin.
-
How to report issues for PowerBI Heatmap?
Kindly email all your issues to support@defteam.com
-
What if DEFTeam stops operating?
We are here to stay. In an unlikely event DEFTeam will release the source code of the Heatmap visual
-
Can we get perpetual license?
No currently we do not provide perpetual license. However, if number of users are greater than 10000 then you can contact sales@defteam.com for more detail.